Податотека:Milankovitch Variations.png
Прејди на прегледникот
Прејди на пребарувањето
Нема верзија со поголема разделност.
Milankovitch_Variations.png (479 × 363 пиксели, големина: 32 КБ, MIME-тип: image/png)
Опис
| Опис |
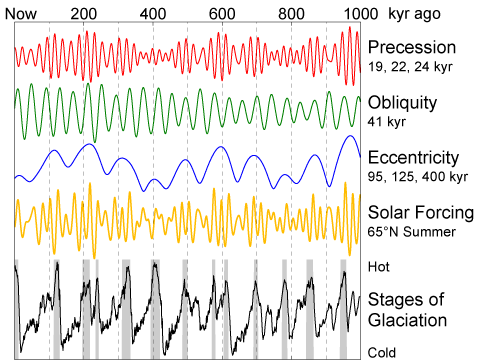
English: This figure shows the variations in Earth's orbit, the resulting changes in solar energy flux at high latitude, and the observed glacial cycles.
According to Milankovitch Theory, the precession of the equinoxes and the apsides, variations in the tilt of the Earth's axis (obliquity) and changes in the eccentricity of the Earth's orbit are responsible for causing the observed 100 kyr cycle in ice ages by varying the amount of sunlight received by the Earth at different times and locations, particularly high northern latitude summer. These changes in the Earth's orbit are the predictable consequence of interactions between the Earth, its moon, and the other planets. The orbital data shown are from Quinn et al. (1991). Principal frequencies for each of the three kinds of variations are labeled. The solar forcing curve (aka "insolation") is derived from July 1st sunlight at 65 °N latitude according to Jonathan Levine's insolation calculator [1]. The glacial data are from Lisiecki and Raymo (2005) and gray bars indicate interglacial periods, defined here as deviations in the 5 kyr average of at least 0.8 standard deviations above the mean. |
| Датум | 11 февруари 2006 (датум на подигање) |
| Извор | сопствено дело |
| Автор | This image was produced by Robert A. Rohde from publicly available data, and is incorporated into the Global Warming Art project. |
| Други верзии | Изведени дела од оваа податотека: Variacions de Milankovitch.png |
References
- Lisiecki, L. E., and M. E. Raymo (2005), "A Pliocene-Pleistocene stack of 57 globally distributed benthic δ18O records." Paleoceanography 20, PA1003, doi:10.1029/2004PA001071 (alternative full text link: [2][мртва врска]).
- Quinn, T. R., S. Tremaine, and M. Duncan (1991), "A Three Million Year Integration of the Earth's Orbit." The Astronomical Journal 101, pp. 2287-2305, doi:10.1086/115850.

|
Оваа слика (или сите слики од оваа страница/категорија) би требало бидат се преработи користејќи векторска графика со формат SVG. Тоа нуди неколку предности; видете „Податотеки за расчистување“ за повеќе информации. Доколку оваа слика веќе постои во SVG формат, тогаш подигнете ја. Откако ќе го направите тоа, заменете ја оваа предлошка со предлошката {{Vector version available|име на новата податотека.svg}}.
|
Лиценцирање
Image from Global Warming Art
This image is an original work created for Global Warming Art. Please refer to the image description page for more information.

|
Се дава дозвола за умножување, распространување и/или менување на овој документ под условите на ГНУ-овата лиценца за слободна документација, само Верзија 1.2 или било која понова верзија објавена од Фондацијата за слободна програмска опрема; без неменливи делови и без текстови на предни и задни корици. Примерок од лиценцата ќе најдете во делот наречен ГНУ-ова лиценца за слободна докуменација. |
| Оваа податотека е под лиценцата Криејтив комонс Наведи извор-Сподели под исти услови 3.0 Нелокализирана. | ||
| ||
| Оваа ознака за лиценца е додадена на податотекава како дел од подновата на лиценците на ГЛСД. |
Историја на податотеката
Стиснете на датум/време за да ја видите податотеката како изгледала тогаш.
| Датум/време | Минијатура | Димензии | Корисник | Коментар | |
|---|---|---|---|---|---|
| тековна | 12:35, 11 февруари 2006 | | 479 × 363 (32 КБ) | wikimediacommons>David Legrand | == Description == This figure shows the variations in Earth's orbit, the resulting changes in solar energy flux at high latitude, and the observed glacial cycles. According to Milankovitch Theory, the precession of the [[ |
Употреба на податотеката
Податотекава се користи во следнава страница: