Податотека:Prime number theorem ratio convergence.svg
Прејди на прегледникот
Прејди на пребарувањето

Големина на овој PNG-преглед на оваа SVG-податотека: 250 × 160 пиксели. Други разделности: 320 × 205 пиксели | 640 × 410 пиксели | 1.024 × 655 пиксели | 1.280 × 819 пиксели | 2.560 × 1.638 пиксели.
Изворна податотека (SVG податотека, номинално 250 × 160 пиксели, големина: 87 КБ)
Опис
| Опис |
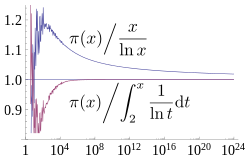
English: A plot showing how two estimates described by the prime number theorem, and converge asymptotically towards , the number of primes less than x. The x axis is and is logarithmic (labelled in evenly spaced powers of 10), going up to 1024, the largest for which is currently known. The former estimate converges extremely slowly, while the latter has visually converged on this plot by 108. Source used to generate this chart is shown below. |
| Датум | |
| Извор | сопствено дело |
| Автор | Dcoetzee |
| SVG разработка |


Лиценцирање
Јас, праводржецот на ова дело, со ова го објавувам истото под следнава лиценца:
| Оваа податотека е достапна под лиценцата Криејтив комонс CC0 1.0 Предавање во јавна сопственост. | |
| Лицето поврзано со делото со овој документ го има предадено истото во јавна сопственост, откажувајќи се од сите права на тоа дело за цел свет, под законот за авторско право и поврзани или сродни законски права што ги имало на тоа дело, дотолку колку што е дозволено со закон. Делата под CC0 не бараат припишување (наведување автор и/или извор). Кога го наведувате делото, наводот не треба да подразбира каква било поддршка од авторот.
|
Source
All source released under CC0 waiver.
Mathematica source to generate graph (which was then saved as SVG from Mathematica):
(* Sample both functions at 600 logarithmically spaced points between \
1 and 2^40 *)
base = N[E^(24 Log[10]/600)];
ratios = Table[{Round[base^x],
    N[PrimePi[Round[base^x]]/(base^x/(x*Log[base]))]}, {x, 1,
    Floor[40/Log[2, base]]}];
ratiosli =
  Table[{Round[base^x],
    N[PrimePi[
       Round[base^x]]/(LogIntegral[base^x] - LogIntegral[2])]}, {x,
    Ceiling[Log[base, 2]], Floor[40/Log[2, base]]}];
(* Supplement with larger known PrimePi values that are too large for \
Mathematica to compute *)
LargePiPrime = {{10^13, 346065536839}, {10^14, 3204941750802}, {10^15,
     29844570422669}, {10^16, 279238341033925}, {10^17,
    2623557157654233}, {10^18, 24739954287740860}, {10^19,
    234057667276344607}, {10^20, 2220819602560918840}, {10^21,
    21127269486018731928}, {10^22, 201467286689315906290}, {10^23,
    1925320391606803968923}, {10^24, 18435599767349200867866}};
ratios2 =
  Join[ratios,
   Map[{#[[1]], N[#[[2]]]/(#[[1]]/(Log[#[[1]]]))} &, LargePiPrime]];
ratiosli2 =
  Join[ratiosli,
   Map[{#[[1]], N[#[[2]]]/(LogIntegral[#[[1]]] - LogIntegral[2])} &,
    LargePiPrime]];
(* Plot with log x axis, together with the horizontal line y=1 *)
Show[LogLinearPlot[1, {x, 1, 10^24}, PlotRange -> {0.8, 1.25}],
 ListLogLinearPlot[{ratios2, ratiosli2}, Joined -> True],
 LabelStyle -> FontSize -> 14]
LaTeX source for labels:
$$ \left.{\pi(x)}\middle/{\frac{x}{\ln x}}\right. $$
$$ \left.{\pi(x)}\middle/{\int_2^x \frac{1}{\ln t} \mathrm{d}t}\right. $$
These were converted to SVG with [1] and then the graph was embedded into the resulting document in Inkscape. Axis fonts were also converted to Liberation Serif in Inkscape.
Историја на податотеката
Стиснете на датум/време за да ја видите податотеката како изгледала тогаш.
| Датум/време | Минијатура | Димензии | Корисник | Коментар | |
|---|---|---|---|---|---|
| тековна | 14:07, 21 март 2013 | | 250 × 160 (87 КБ) | wikimediacommons>Dcoetzee | Change n to x to match article |
Употреба на податотеката
Податотекава се користи во следнава страница: